The Baseline Deserves a Seat
Simple comparisons reveal what a complicated model adds—and whether a benchmark can detect that addition.
The common case can look impressive
Imagine a forecasting system that predicts sunshine every day in a place where sunshine is common. Its accuracy may sound excellent. The result says much less about whether it can recognize a storm. A simple baseline exposes this difference by asking what performance we get without a sophisticated model. It makes the achievement legible: which difficult or useful predictions did the model add beyond the common case?
A baseline is part of the argument, not an optional footnote. It can be a constant prediction, an average, a simple rule, or a modest statistical model. The right comparison depends on the task and the information available. A sophisticated predictor should not be compared with an artificially weak alternative when a straightforward competitor captures most of the signal.
The same care applies to classification. If one class dominates, overall accuracy may hide poor performance on the others. If training and test examples share collection artifacts, a model can exploit those artifacts. Looking at errors by subgroup, context, and type of change often reveals more than a single headline score. The baseline asks what is easy; the evaluation should make clear whether the model also contributes where the scientific problem is hard.
A cell profile contains much that stays the same
Biological measurements often contain a substantial common background. Two conditions can differ in a small set of features while most recorded values remain similar. A prediction near the average can consequently achieve low overall error without accurately recovering the changes that matter. This possibility should be investigated, rather than assumed to explain every strong baseline result.
Several competitors answer distinct questions. A control-profile baseline predicts a familiar unaltered state. A mean baseline predicts an average response in the available data. A linear model learns straightforward relationships among its inputs and outputs. An additive baseline combines separate effects to predict a joint response. Calling all of these “no change” conceals what each comparison establishes. Some use information about responses; others do not.
A model might improve on one competitor but lose to another. That is useful information about the contribution it makes. It may capture a shared response while failing to distinguish particular conditions, or distinguish conditions while missing overall magnitude. Instead of treating the baseline as a single hurdle, ask which aspect of the target each competitor already knows. The model's added value then becomes a more specific and defensible scientific statement.
What the 2025 benchmark challenged
Ahlmann-Eltze, Huber, and Anders' 2025 Nature Methods paper, Deep-learning-based gene perturbation effect prediction does not yet outperform simple linear baselines, compared learned predictions with straightforward alternatives. The tested deep methods did not consistently outperform those alternatives on the evaluated tasks. This was a substantial challenge to confident claims about the immediate benefits of large-scale representation learning for predicting unfamiliar responses.
The force of such a result is empirical. It identifies a gap between an advertised ambition and a demonstrated contribution in particular datasets and metrics. It does not by itself prove that the data contain no useful information, that every architecture has the same limit, or that future methods cannot improve. A plateau could reflect a data limitation, an objective, an optimization problem, an evaluation weakness, or several factors together.
We should take the result seriously enough to alter our standards of evidence. A representation model that helps organize observations has shown one kind of value. A model asked to predict the consequences of change needs evaluation on consequences of change. Success on an easier descriptive task cannot settle the harder claim. Equally, failure on a particular benchmark should motivate diagnosis before it becomes a universal story about what scientific AI is capable of learning.
The benchmark needs a positive control
The debate gained an important qualification on 1 October 2026. Miller and colleagues' Nature Biotechnology paper, Deep learning perturbation models can outperform baselines on calibrated metrics, examined whether common scores could distinguish informative predictions from uninformative ones. Their analysis found that metric calibration could reveal meaningful model signal obscured by standard comparisons, and that models could surpass additivity with more informative combination coverage.
This is a reason to examine both sides of the comparison. A negative control tells us what an uninformative predictor can achieve. A suitable positive control asks whether the evaluation rewards an answer known to contain the relevant signal. If a score barely separates the two, a model's weak showing on that score may reflect the score's insensitivity as well as the model's shortcomings.
Calibration does not entitle us to choose whichever metric makes a favored model look best. Complementary measures can reveal different strengths and weaknesses, and performance still depends on datasets and tasks. The constructive lesson is that a benchmark must demonstrate its ability to detect the contribution we care about. Baseline criticism and benchmark criticism belong in the same scientific conversation. Each can prevent a confident numerical result from being mistaken for a settled interpretation.
The interaction lives in the difference
Combined changes offer a demanding case. Suppose we know how a system responds to A and how it responds to B. We form an expectation for the joint response using a stated rule. The difference between that expectation and the observed combination is an interaction residual. Predicting the overall joint profile and predicting this residual are related but distinct accomplishments.
The expectation must suit the measured quantity. Additivity on one scale may correspond to multiplication on another. Choosing the wrong scale can create apparent departures that belong to the arithmetic rather than to the system. Even a genuine departure does not uniquely identify the internal wiring: several mechanisms can produce a similar interaction, and a particular sign need not have one exclusive explanation.
Nevertheless, residuals can focus the question. A method that reproduces the separate effects may have little evidence about their combination. A method that reliably predicts held-out interactions contributes more than the separate effects alone provide. That success should be reported with its contexts, coverage, and uncertainty. It supports a particular generalization claim. Establishing a mechanism still requires considering rival explanations and independent evidence that could discriminate among them.
The measurement pipeline is part of the model
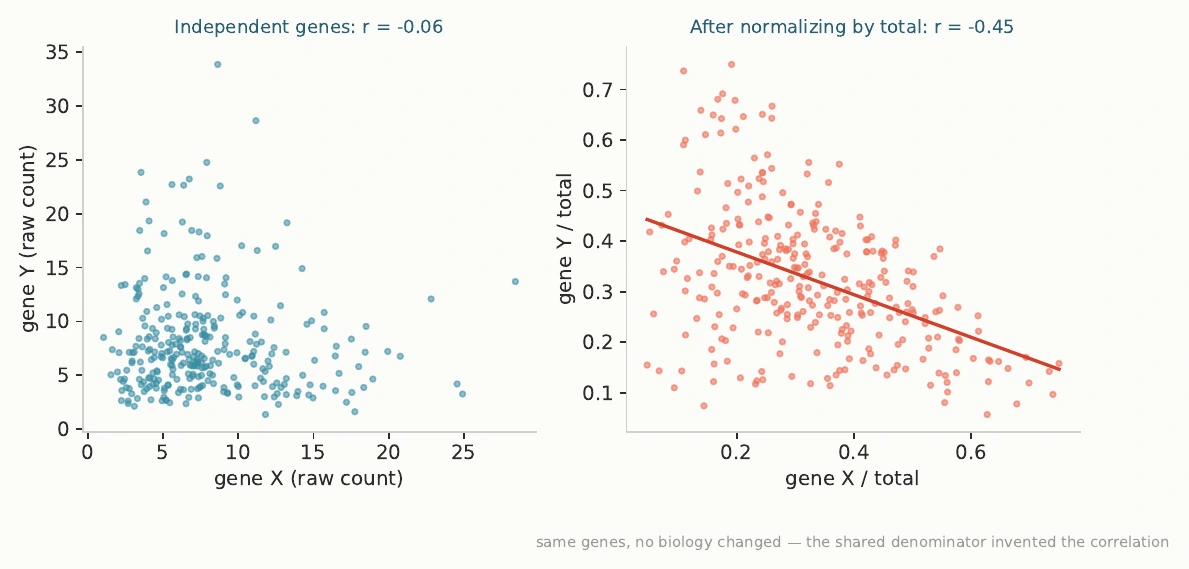
Before learning begins, preprocessing can reshape relationships in the data. If several measurements are divided by a shared total and made to sum to one, their proportions cannot vary freely. Increasing one share constrains the others. Correlations among the transformed values may therefore differ from relationships among the original quantities. The illustration shows this effect in a toy example with independently generated inputs.
This does not mean normalization is inherently mistaken or that every correlation is artificial. Measurements can differ for technical reasons, so adjustment may be essential. It means the resulting patterns reflect the system and the pipeline together. A model rewarded for reproducing those patterns has no automatic obligation to separate their origins. That separation requires suitable assumptions, checks, or additional information.
The discipline is familiar from ordinary science: inspect what was measured, compare appropriate controls, and make uncertainty visible. In machine learning, the scale of the machinery can make those habits seem secondary. They remain central. A credible claim links a useful target to a sensitive evaluation and an informative comparison. The model earns trust by showing what it adds; the benchmark earns trust by showing it can recognize that addition.